Build an AI SRE Agent with Coral
Kyra Cheng and James Audretsch · · engineering · implementation
This guide describes how to build a simple, powerful AI SRE agent that you own and control. It runs on your infrastructure, reads your data sources, and every step - the prompt, the queries, the traces, the output - is visible and editable. Setup takes an afternoon and uses a few hundred lines of code.
Here’s how the agent helps:
- When an alert monitor, in this example Datadog, posts an alert to a Slack channel, the agent, added to the channel as a Slackbot, begins an investigation.
- You can also ask the agent’s Slackbot questions with @-mentions and DMs.
- The agent investigates, querying your telemetry, code, and past incident discussions via Coral, finding evidence to help diagnose the cause of the alert or described problem.
- The agent’s Slackbot replies in-thread with the likely cause, the evidence behind it, a suggested fix, and links back to the data it used.
- You review and ask follow-ups in the thread. The agent is read-only; it diagnoses, but doesn’t implement changes directly.
Because data remains in your environment, you can integrate additional data sources that you wouldn’t want to share externally with a comparable SaaS product. This enables higher diagnosis accuracy. On our internal benchmarks of real-world alert and incident investigations, this agent implementation was more accurate and, even with a frontier model, >90% lower cost than Datadog’s Bits AI.
Every command, prompt, and query in this guide is from the working build.
Want to try it in five minutes first?
The fastest way to see Coral driving an SRE investigation is the local notebook, which runs on your machine with no Slack app or cloud deployment required. Start there to get a feel for it, then come back here to build the always-on Slack version.
Notebook -> local_sre_agent.ipynb
Table of Contents
- 1. Connecting Coral to Datadog, GitHub, Slack, Sentry
- 2. Alert to investigation
- 3. Model, deployment and transport
- 4. Writing the agent
- 5. Investigating with Coral
- 6. Extending the agent
- 7. Conclusion
1. Connecting Coral to Datadog, GitHub, Slack, Sentry
Coral ships with bundled source specs, as well as the ability to easily create your own. This example build uses four of the bundled sources, but you could use alternatives:
- Datadog for alert monitors, logs, metrics and traces.
- Sentry for exceptions and error grouping.
- GitHub for code and change history.
- Slack for team discussions about historic alerts and incidents.
You could also add other types of sources we have built into Coral, e.g. Intercom (customer support tickets), Linear (project management), PagerDuty (on-call), Confluence (runbooks). See more in Section 6.
Connecting them takes three steps: install Coral, add sources, and point your agent at it.
Install Coral
macOS, via Homebrew:
brew install withcoral/tap/coralInstall script:
curl -fsSL https://withcoral.com/install.sh | shSee the installation guide for more options.
Add sources
coral onboardfor an interactive setup.coral source discoverto see the full list of bundled sources.coral source add --interactive [source name]to connect each source.coral source listto see the sources installed.
Note: the Slack source needs an app with read scopes (channels:history, channels:read, groups:history, users:read) installed in the target workspace. The agent can only read channels the app is a member of, so invite it to the channels you want it to see. Full Slack app setup - including the bot vs. app tokens for the live bot - is covered in Section 2.
A quick way to confirm everything’s queryable is to ask Coral for its own table catalogue:
SELECT 'table' AS kind, schema_name, table_name AS name
FROM coral.tables
WHERE schema_name IN ('datadog', 'github', 'slack', 'sentry')
UNION ALL
SELECT 'table_function' AS kind, schema_name, function_name AS name
FROM coral.table_functions
WHERE schema_name IN ('datadog', 'github', 'slack', 'sentry')
ORDER BY schema_name, kind, name;The agent writes SQL which Coral transforms into the optimal API calls, handling auth, pagination and rate limits. Coral then returns rows of data to the agent. Data source credentials stay in Coral’s local config and are read only at query time - they don’t enter the model’s context, the transcript, or the logs, and they don’t leave the machine Coral runs on. Every answer traces back to specific rows from specific queries, so the investigation is auditable by default.
Access is per-source today: install only the sources you want exposed. Per-table and per-column control are on our roadmap. For an internal agent on trusted infrastructure, per-source is usually sufficient. For multi-tenant or external use, run Coral on a dedicated machine with only the credentials you’re willing to expose.
Connect your agent to Coral
The in-code (Pydantic AI) agent registers Coral’s MCP server as a toolset - a few lines of Python, shown in Section 4. Once wired, the tables above are queryable. How the agent connects - and when you’d run Coral as a separate service - is covered in Section 3.
2. Alert to investigation
The agent reaches Slack over Socket Mode: the bot opens an outbound WebSocket to Slack and receives events over it. There’s no webhook, no public endpoint, and no ingress - the entire setup runs inside your environment without exposing anything to the internet.
The flow: Datadog posts alerts to an #alerts channel. The SRE agent bot is in that channel; when the Datadog app posts a new alert, the bot auto-investigates and replies in-thread. It also responds to @-mentions in any channel it’s in, and to DMs - so an engineer can ask follow-ups in the same thread.
To set up the Slack app, you need an app with Socket Mode enabled, the read scopes from Section 1 plus im:history, app_mentions:read, chat:write, and assistant:write, the right event subscriptions (app_mention, message.im, message.channels), and two tokens: an app-level token (xapp-..., connections:write) for the socket and a bot token (xoxb-...) for the API. We link the full steps rather than reproduce them here - Slack’s Socket Mode docs are the source of truth. Note: use the bot token (xoxb-), not the user token (xoxp-) - the user token authenticates as you and the bot silently never receives events.
For deployment, Coral and the agent run together as one process. We packaged it as a Docker image, pushed it to Amazon ECR, and ran it as a single-replica Kubernetes Deployment - Socket Mode needs exactly one connection, so one replica, and no Service or Ingress because nothing connects in. We used EKS; the deploy details will differ in your environment, but the requirements are minimal - it’s a single long-running process with outbound network access and no inbound endpoint.
3. Model, deployment and transport
Before the agent itself, three setup decisions shape how this runs: which model drives it, where Coral lives relative to the agent, and how the two connect. Here’s what this build chose and when you’d choose differently.
Choosing a model
The agent talks to the model through one env var (SRE_AGENT_MODEL), so swapping is a one-line change. Our recommendation: Claude Opus 4.7 as the default for quality - it’s what the deploy shown here runs, and it produced the strongest, best-grounded investigations in our testing. If cost efficiency matters more than the last bit of quality, two open-weights models held up well in the same tests at a fraction of the price: DeepSeek V4 Pro (recommended open-weights default - fastest of the ones we tried, lowest tool budget, fully source-grounded) and Qwen 3.7 Max (comparable quality, somewhat slower, with a 1M-token context window that helps on richer prompts). Both run roughly 5-10x cheaper per million tokens than Opus 4.7.
Investigation quality depends on the model being good at deciding which query to write next from partial evidence - a harder skill than answering a single question - so the strongest models have a real edge, and the gap widens as the data gets messier. On a small demo it’s barely visible. We recommend the three above because we’ve run them end-to-end; treat anything else as untested until you’ve tried it on a few real alerts.
Where Coral runs
In this build, Coral runs on the same machine as the agent - the simplest setup, and identical to how it runs on a dev machine.
For an internal agent on trusted infrastructure that’s usually fine. We run the agent in-code (Pydantic AI) with no access to the host filesystem or shell - it can only query data via Coral’s MCP. An alternative approach are coding agents like Claude Agent SDK or OpenCode, which are more capable (it can read files, run commands, write scratch output) but need sandboxed isolation for security. For a read-only investigator agent, in-code is the smaller, safer default; reach for the sandbox when you want the agent to do more than query and report.
For production, it’s often worth running Coral as its own separate server, for two reasons. The first is credential isolation: Coral holds the tokens for every source, so if the agent is ever sandboxed for untrusted input or otherwise compromised, you don’t want those tokens sitting where it can reach them - running Coral as its own service keeps credentials behind a boundary the agent can query through but never touch. The second is scaling: a dedicated Coral server is easier to share across multiple agents than one bundled into a single agent process.
How the agent connects to Coral
This build connects over stdio: the agent launches Coral as a subprocess and they talk over standard input/output. It’s the simplest wiring and the right default when Coral and the agent run together - no ports, no network surface. If you split Coral out as its own service (above), you’d instead connect over HTTP, with Coral running as a server one or more agents reach over the network - useful when several agents share one Coral, or when Coral sits behind the credential boundary on a separate host. Same MCP protocol either way; only the connection changes, so moving between them is a config change, not a rewrite.
4. Writing the agent
The agent is a Pydantic AI agent with Coral’s MCP server registered as a toolset. It’s read-only by design - it queries and reports, it never pages, deploys, or mutates. The whole thing is the system prompt below plus a few lines of wiring.
Here’s the wiring - registering Coral as a toolset is the whole integration:
def _build_agent(self, *, event_stream_handler=None) -> Agent:
    coral_server = MCPServerStdio(
        self.coral.coral_bin,
        args=self.coral.mcp_args,
        env=load_coral_env(),
        timeout=10,
        include_instructions=True,
        max_retries=50,
    )

    return Agent(
        _pydantic_model_name(self.model),
        instructions=SYSTEM_PROMPT,
        toolsets=[coral_server],
        model_settings=_model_settings(max_tokens=MAX_OUTPUT_TOKENS),
        event_stream_handler=event_stream_handler,
    )
The toolsets=[coral_server] line is the entire Coral integration - every table becomes a tool the agent can query. include_instructions=True is what pulls in Coral’s own usage guidance, so the prompt below can stay focused on the SRE task. Full file: agent.py. For how Pydantic AI handles MCP toolsets, see the Pydantic AI MCP docs.
Set the model with one env var (SRE_AGENT_MODEL). This build defaults to a frontier model (Claude Opus 4.7); the walkthrough in Section 5 runs on DeepSeek V4 Pro to show the swap. See Section 3 for how to choose between them.
Here’s the system prompt in full (also in agent.py):
You are an AI SRE assistant operating inside Slack.

Operating principles:
- Treat Datadog, Slack, GitHub, and Sentry as evidence sources. Use Coral MCP tools
  before making factual claims about incidents, alerts, deployments, errors, owners,
  or recent status.
- Prefer narrow read-only SQL queries with LIMIT clauses. Avoid broad scans unless
  explicitly asked.
- Distinguish observations from hypotheses. Tag hypotheses with confidence
  (high/medium/low) and cite the evidence that supports or contradicts them.
- Say "unknown" when evidence is missing. Never fabricate IDs, counts, timestamps,
  file paths, or line numbers.
- Do not claim to have paged, deployed, reverted, muted, acknowledged, resolved, or
  changed anything. This agent is read-only.
- Cite sources of important evidence: Coral table names, record identifiers,
  timestamps, counts.

When the prompt describes an alert or incident, produce a structured assessment
using `## H2` section headers (rendered inside the Slack markdown block):

## Summary — one line: what's broken, where, and the scope.

## Evidence — flat bullet list. Each bullet names the Coral source/table and the
specific finding (IDs, counts, timestamps). Use a Markdown table when comparing
several rows of similar data (issues, events, commits).

## Likely cause — hypothesis with confidence level. If the failure points to a code
path (e.g. a Python exception with file:line in the stack trace), look up the file
in GitHub via Coral (`github.commits`, `github.contents`, or related tables) and
quote the offending line in a fenced code block with a language hint so the
diagnosis is grounded in the actual source.

## Blast radius — affected services, endpoints, user count if known. Call out
absence of evidence too ("APM data not available", "no open incident").

## What changed — recent commits, deploys, releases, or config changes that
correlate with onset. If no signal, say so plainly and explain the gap (e.g. no
Sentry release tag).

## Mitigation / next checks — actionable bullets. Use a `### Immediate` and `###
Durable` subsection to separate stop-the-bleeding fixes from root-cause +
prevention.

## Sources — final section. A flat bullet list of Markdown links to the resources
cited above. **Prefix every bullet with the source name in bold square brackets** so
a reader scanning the list sees instantly what each link points at. One bullet per
link. Use the URL templates from the deployment context when provided.

  - **[Datadog]** [Monitor {monitor_id} — {monitor
name}](https://app.datadoghq.com/monitors/{monitor_id})

  - **[Sentry]** [{ISSUE-SHORT-ID} — {exception type at
endpoint}](https://{org}.sentry.io/issues/{numeric_id}/)

  - **[GitHub]** [{repo
path/to/file.py}](https://github.com/{owner}/{repo}/blob/{branch}/{path})

Whenever you reference a Coral record that has a natural external URL (a Datadog
monitor ID, a Sentry issue short-ID, a GitHub commit SHA or file path), prefer to
render it as a Markdown link in line: `[short text](URL)`. The trailing `## Sources`
section is for the user to quickly jump out to the originating system; inline links
are for context as the reader scans the assessment.

When the evidence includes three or more ordered, timestamped events that tell a
story (e.g. first error → monitor created → recovery → re-fire), consider rendering
them as a small timeline -- a GFM table with `Time | Event | Source` columns is
clearest, ordered earliest-first, with ISO timestamps preserved as-is. Use the
timeline wherever it makes sense (often inside Evidence or What changed); skip it if
the data isn't ordered or there's nothing instructive about the sequence.

For casual questions outside an incident context, skip the structure and answer in
under 100 words.

Response style — your reply is rendered inside a Slack *markdown* Block Kit block,
which accepts standard GitHub-flavored Markdown. Use the richer syntax: it produces
a much nicer reading experience than Slack's older mrkdwn dialect.

- Lead with the answer; no "Let me check…" preamble; no recap of the question.
- *Headers* — `## Section` and `### Subsection` render as real headers. Use them for
  the section labels (Summary, Evidence, Likely cause, Blast radius, What changed,
  Mitigation, Sources) instead of bolded label lines.
- *Bold / italic / strike* — `**bold**`, `*italic*`, `~~strike~~` (full Markdown).
  Inline `code` is single backticks.
- *Multi-line code blocks* — triple backticks WITH a language hint:

  ```python
  display = USERS.get(name)
  return {"message": f"Hello, {display.upper()}!"}
  ```

  Language hints (`python`, `bash`, `sql`, `yaml`, `json`) render with syntax
  highlighting.
- *Lists* — `-` or `1.` at line start. Nested lists work in the markdown block
  (two-space indent). Use task lists `- [x] done` / `- [ ] todo` when useful.
- *Tables* — full GFM pipe syntax. **Must** be preceded by a blank line, or the
  parser glues the header row onto the previous paragraph and the table doesn't
  render. Use them for compact tabular data like a list of recent events or Sentry
  issues:

  | Issue | Count | Last seen |
  |-------|-------|-----------|
  | {ISSUE-SHORT-ID} | {count} | {iso timestamp} |

- *Block quotes* — `> text`.
- *Links* — `[short text](https://example.com)` (standard Markdown). The legacy
  `<url|text>` mrkdwn form does NOT render in the markdown block.
- *Emoji* — `:emoji_name:` (colon-delimited) still works. Use status emojis
  sparingly to anchor scanning: :red_circle: critical, :large_yellow_circle: warning,
  :white_check_mark: ok, :hourglass_flowing_sand: timeout, :mag: investigating.
- *Mentions* — `<@USERID>`, `<#CHANNELID|name>`, `<!here>`. Only use when explicitly
  addressing someone; never fabricate IDs.
- *Horizontal rule* — `---` on its own line for visual section breaks.
This prompt tells the agent to distinguish observations from hypotheses and tag confidence - so the output is a ranked diagnosis, not a guess stated as fact. And it’s explicitly read-only: the agent is told never to claim it changed anything, which keeps the read path safe to point at production. The structured-assessment format (Summary / Evidence / Likely cause / Blast radius / What changed / Mitigation / Sources) is what lands in Slack.
Note: when the agent connects to Coral’s MCP server, Coral provides its own initial instructions on how to query effectively - so the system prompt above can stay focused on the SRE task rather than teaching the agent how to use Coral. If you’re using a coding agent like Claude Code, the same guidance is available as a skill file.
5. Investigating with Coral
Here’s the agent on an alert, start to finish. A Datadog monitor fires “Triggered: Hello Service: Errors too high” into the alerts channel - the demo service has thrown 9 exceptions in the last 5 minutes. The bot is in that channel; it picks the alert up and gets to work.
The first thing it posts isn’t an answer - it’s a plan: “Investigating hello-service error spike (9 errors/5m) - checking Sentry issues, recent commits, and blast radius.” Then it streams its work, each Coral query showing up as it runs with a check or warning beside it. A couple come back retry requested and the agent re-tries and moves on - we left those in rather than edit them out.
You can read the actual SQL as it goes: SELECT id, short_id, title, culprit, level, status, count, user_count, first_seen, last_seen ... FROM sentry.issues for the exception, SELECT sha, author__login, committed_at, additions, deletions, files_changed FROM github.commits for what shipped, interleaved with describe_table and list_columns calls as it checks each schema before querying it. There’s no black box. Every step is a SQL statement against a named table you can audit.
The agent didn’t stop at “there’s an AttributeError.” It pulled the offending file from GitHub and decoded the exact code path - a /greet endpoint that does display = USERS.get(name) and then display.upper(), which throws 'NoneType' object has no attribute 'upper' whenever name isn’t one of the three users in the USERS dict. It quoted the real lines back into the thread. That’s the difference between a plausible guess and a grounded diagnosis: it confirmed the cause against the actual source, not the error message alone.
When it finishes, the assessment lands in the same thread: a one-line summary, the evidence (each line tied to a source and a specific record), the ranked likely cause, blast radius, what changed, and mitigation split into immediate and durable fixes - handle the None return or 404 unknown users, add a unit test for the name not in USERS case, and wire Sentry release tracking so future bursts correlate with deploys.
At the bottom, a Sources list where every chip links back to the record it came from: the Datadog monitor, the Sentry issue PYTHON-FASTAPI-1, the GitHub file and commit. The footer shows exactly what ran: the model, the number of Coral queries, and the time taken.
You’re not limited to what the alert hands you. The bot is in the thread, so you can ask follow-ups, or DM it any time, no alert required. In the following example, a single mention asks two things at once: “@SRE Agent how often is this occurring? have we discussed this before?”
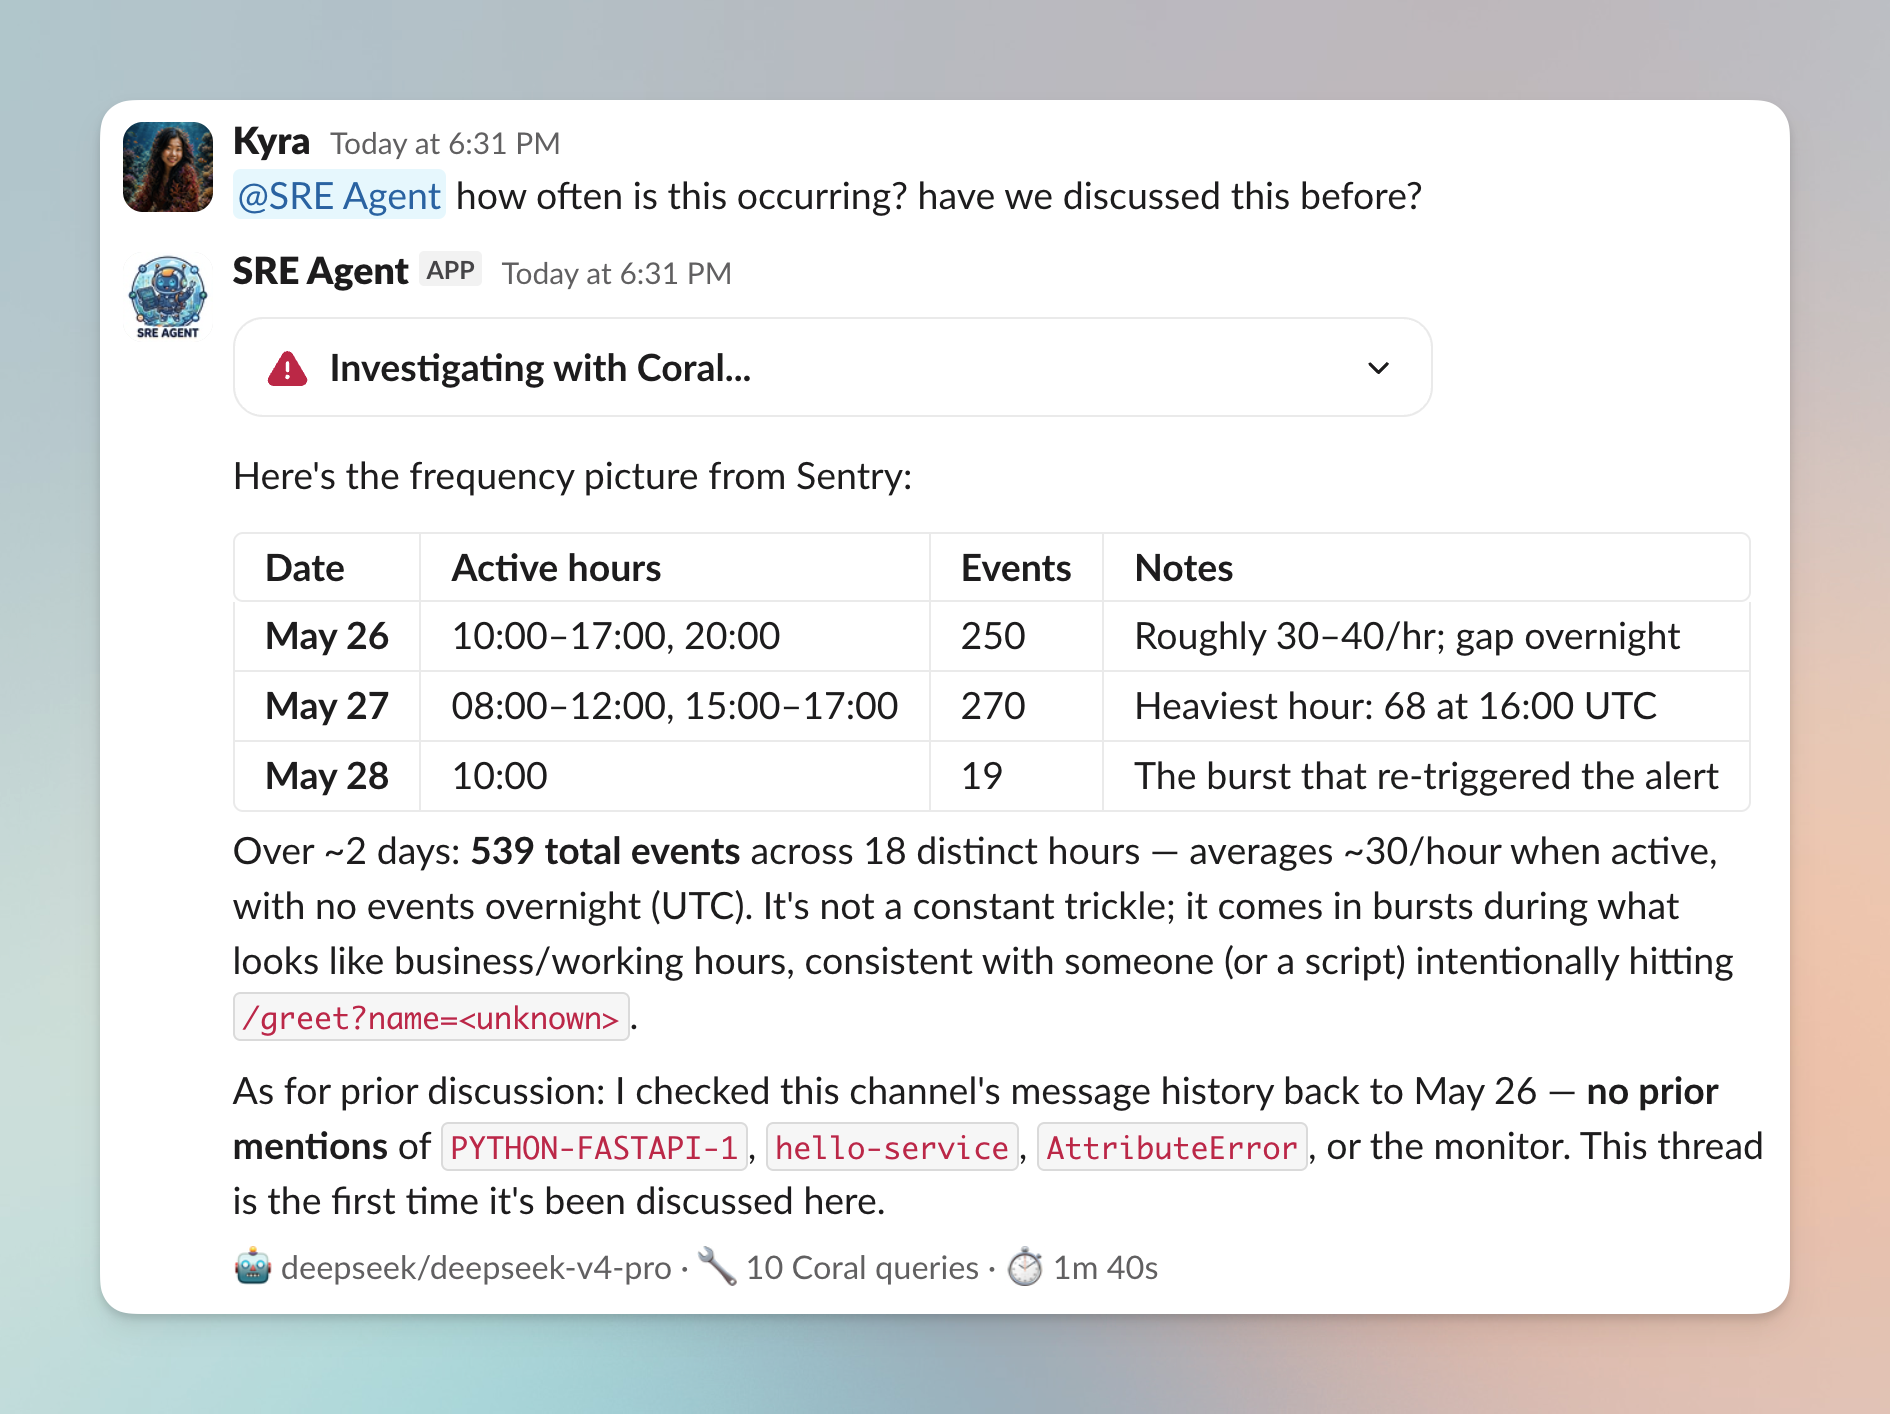
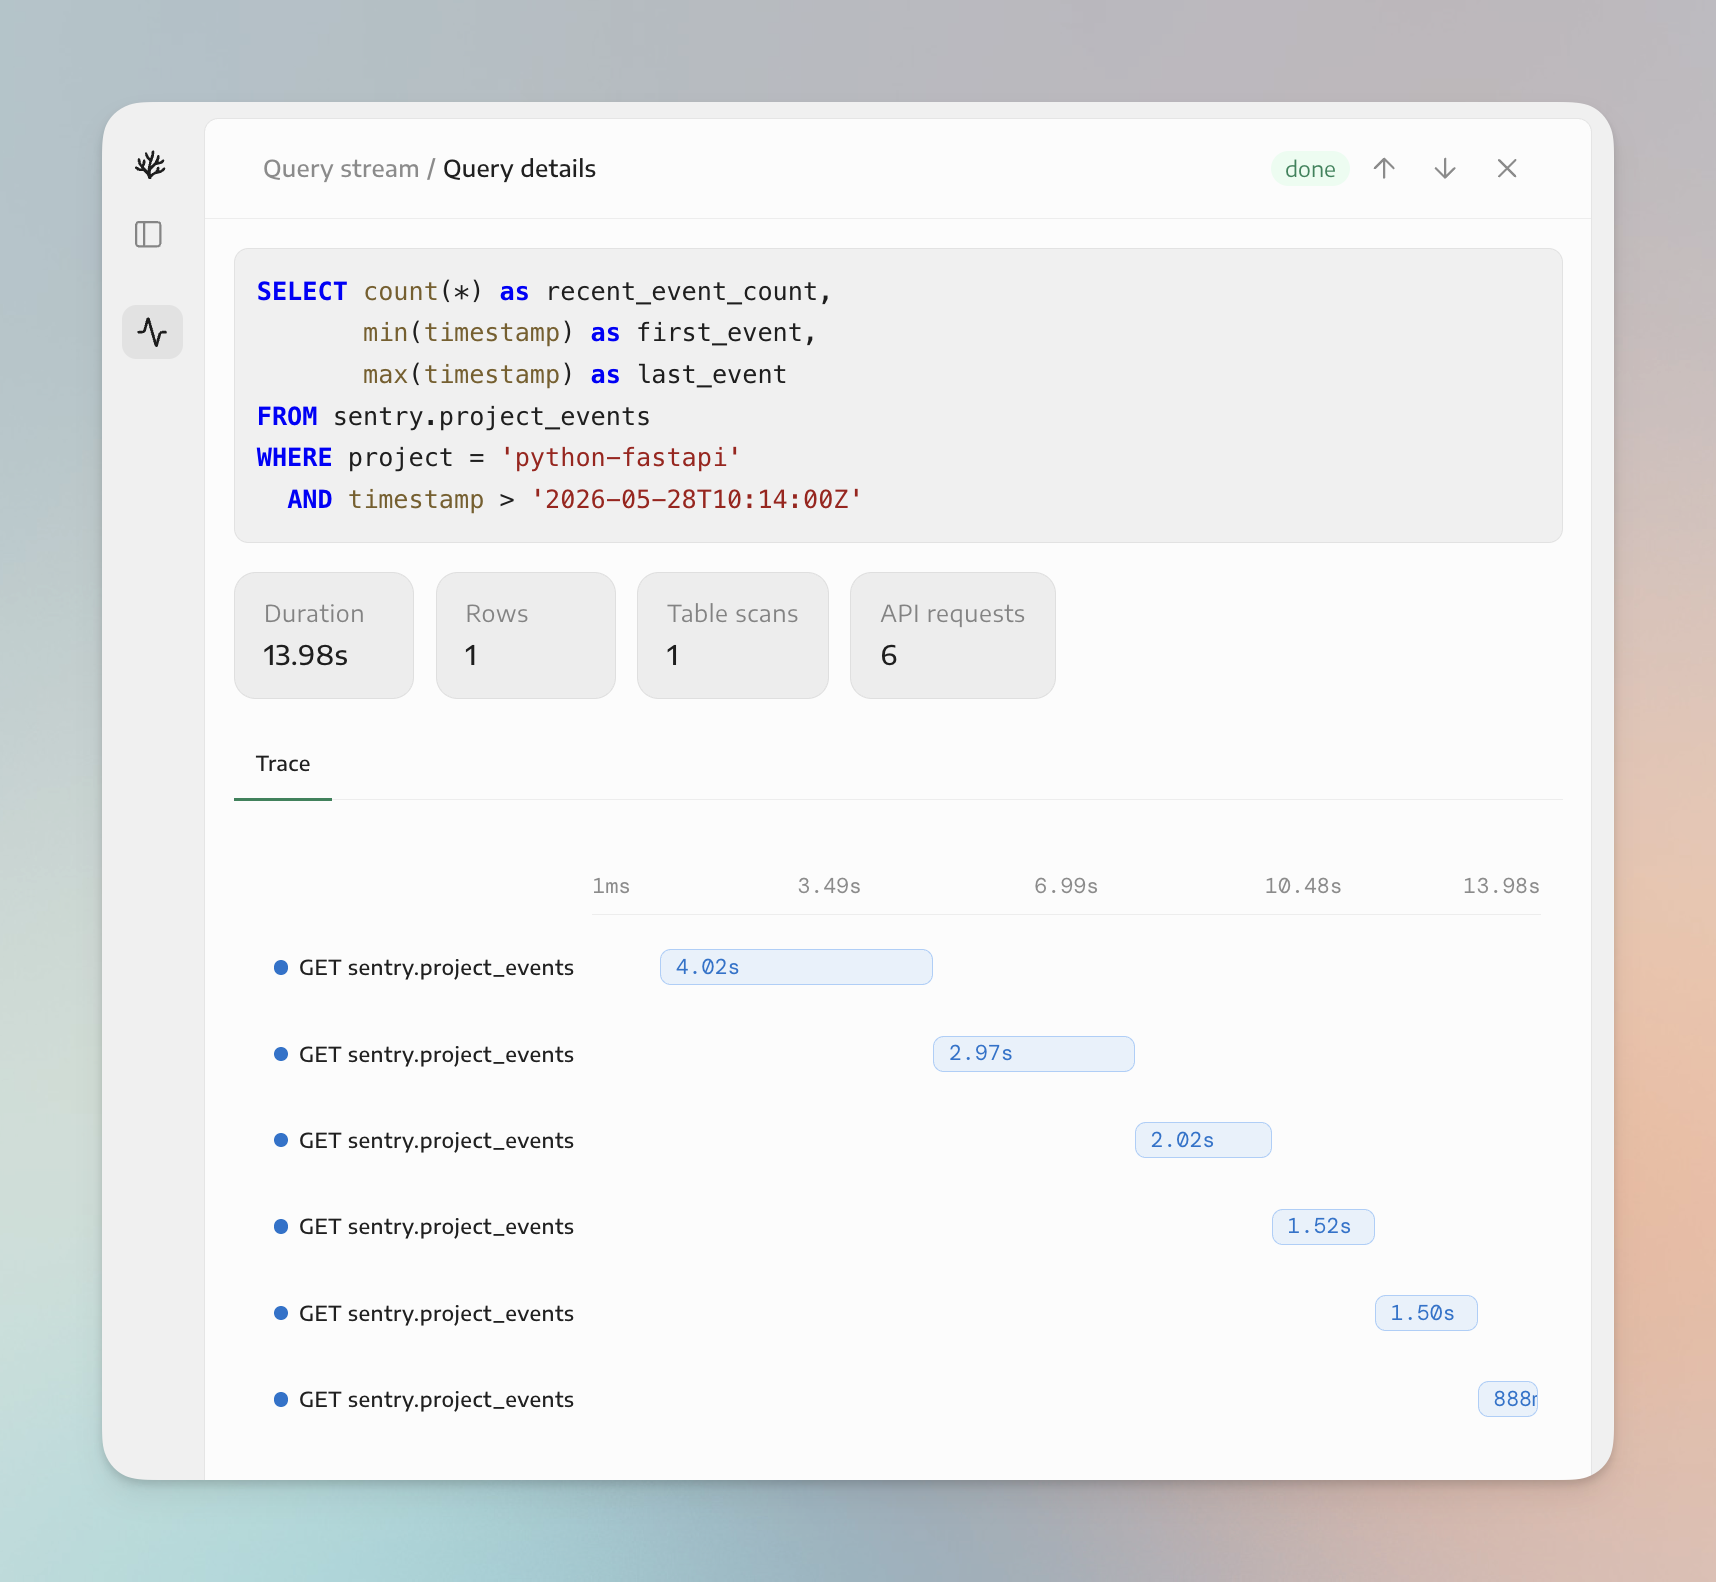
The agent writes new SQL for both questions. For frequency, it buckets sentry.events by hour and returns a real breakdown - 539 events across about 18 distinct hours over two days, averaging ~30 an hour when active with nothing overnight, all consistent with something repeatedly hitting /greet?name=<unknown>. For the history question, it queries slack.messages and slack.thread_replies and reports back that there are no prior mentions of PYTHON-FASTAPI-1, hello-service, or the monitor anywhere in the channel - this is the first time it’s come up. Neither answer was a pre-built report; the agent wrote the queries in the moment and answered from live rows.
This run is on DeepSeek V4 Pro - an open-weights model. The whole investigation you just saw, ran on a model that costs a fraction of a frontier one. Reach for Opus 4.7 when you want the strongest reasoning (see Model, deployment, and transport); the build doesn’t change when you swap - same agent, same prompt, same Coral queries, different model behind one env var.
6. Extending the agent
This is a starting point. To extend it:
- More sources.
coral source add linearto check for an existing ticket,coral source add pagerdutyfor incident lifecycle,coral source add confluencefor runbooks. The prompt already tells the agent to use relevant sources, so they’re picked up without a code change. - Your own systems. Anything with an API can be a Coral source via a short manifest - a service exposing pod health, an internal service map, a deploy tracker. The agent queries it like any other table. This is what a hosted vendor can’t give you: the agent reasoning over your own context.
- Bring your own agent. If you’re already on the Claude Agent SDK, LangChain, Pydantic AI, or your own harness, Coral drops in as the data layer instead of a hand-written MCP server with a tool per system.
7. Conclusion
That’s the whole build: a read-only SRE agent over Datadog, GitHub, Slack, and Sentry, or alternative sources, in a few hundred lines you control. The work Coral handles is giving the agent more dependable and efficient access to your data sources - and we are rapidly adding new features to make this even better.
If you’re putting an agent like this into production and want support, reach out here.